|
|
|
|
|
8.1. High-Latitude Background Emission
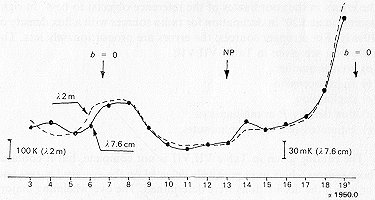
Only the narrow band of the Milky Way near bII= 0o has been studied at centimeter wavelengths; even here, the most sensitive surveys of the Milky Way have gaps toward the anticenter. We attempted to study the nature of the Galactic emission far away from the region usually studied (bII= + 2o); the band of sky studied in Experiment Cold included the Milky Way, as well as a region with bII = 70o. During Experiment Cold, we convinced ourselves that the 24-h-long scans of the background are fairly repeatable under sufficiently good conditions. An example of two such scans at azimuth A = 30o is shown in Fig. 6.10. We then chose 13 good scans from the 26 24-h-long drift curves at azimuth A = 30o ("Experiment Cold-2") and constructed an average profile of the background emission of the sky for these 13 days (the discrete sources were removed); see Fig. 8.1. Analysis of such an averge scan leads to the following results:
the Milky Way: we detected background emission toward the anticen-ter for the first time, near the radio source W16.
(2) The region with the lowest antenna temperature occurs in the region with coordinates 11h<a<15h, i.e., the region with the highest galactic latitude.From these two results, it can be concluded that the dominant feature in the background emission of the sky is the Galaxy, and that we see the Galactic radio emission at all latitudes, including the regions near the Galactic pole. Since this is the first time the high-latitude background has been detected at centimeter wavelengths by radio astronomers, we made an attempt to estimate the spectrum of this emission by comparing our data with published isophotes at 2 m (Landecker and Wielebinskii, 1970). After removing a linear baseline, we obtained surprisingly good agreement between the temperature profiles obtained at meter wavelengths (l = 2 m) and 7.6 cm (Fig. 8.1) (we will not go into the problems of the region bII =
What is the high-latitude emission due to? At present, the data are not reliable enough to solve this problem. A slight asymmetry in the brightness toward the Galactic center and the anticenter indicates that the Galactic corona may make a contribution, although the idea that we are merely observing emission from our spiral arm of the Galaxy is not ruled out. Some combine the results on the spectrum of the emission in this direction with theories for maintaining the energy of energetic electrons. Thus, the flat spectrum of this radio emission may support several theories involving the acceleration of cosmic rays by the envelopes of old supernovae, and in which practically all of the non-thermal Galactic background is attributed to the total emission from such supernova remnants. The large scale structure of the background emission is difficult to trace; there are many sources of interference.
As was said in the preceding s ction, we attempted to detect fine structure in the background emission on scales of 0o.8–6o The high interest in such scales is connected with the problem of the diffusion of cosmic rays in the Galaxy. In our average of 22 scans of the region 13h < a < 14h at 7.6 cm, we observed fluctuations which are correlated with features at 31 cm (in our own Experiment Cold results, see Fig. 6.12). The parameters of these features are:
The agreement between the spectral index of the features and the spectral index of the background indicates that we are probably seeing variations in the brightness of the high-latitude, nonthermal background emission of the Galaxy. In Fig. 8.2, we have shown the spectrum of the emission from the brightest feature, as well as the dispersion in the brightness distribution of the background emission from our data at 7.6 and 31 cm. In the same figure, we have shown the dispersion in the brightness distribution of the background emission from surveys at 73 cm using the 100-m paraboloid. The latter dispersion is a factor of two or three greater than follows from an extrapolation of our shorter-wavelength measurements. We now believe that confusion noise makes a perceptible contribution at 73 cm; this conclusion is based on improved
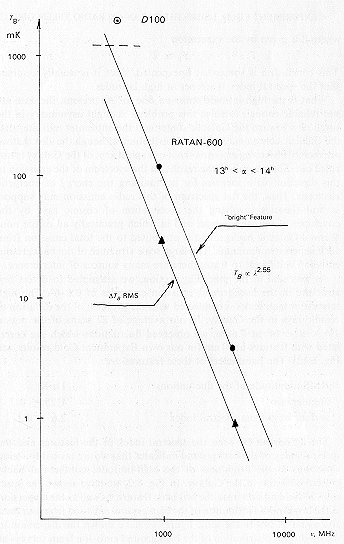
theoretical analyses of the role of background sources at 73 cm, as well as the fact that the fluctuations we have observed at 7.6 cm and 31 cm are weakly correlated with the fluctuations in the same region of the Galaxy at 73 cm (see Fig. 6.11).
It is interesting to determine the percentage amplitude of the fluctuations
in the high-latitude Galactic emission. To do this, we can use the absolute
measurements of the sky brightness at 73 cm and the strong correlation
between the temperature profiles at 7.6 cm and 2 m. An analysis shows that
TB = 50 ![]() 20mK at the minimum in the background emission, i.e.
20mK at the minimum in the background emission, i.e.
Finally, we shall note that an analysis of 10,000 harmonics in the antenna temperature distribution along the strip of sky studied showed a perceptible influence from the dipole and quadrupole moment of the brightness distribution of the Galactic background emission, and, in addition, on scales of 1o – 2o . The amplitude spectrum is nearly a Kolmogorov spectrum, although we believe that atmospheric noise rather than Galactic noise dominates between these two scales. On scales smaller than 15', noise from the atmosphere radiometer is also present. Thus, we are not now able to explain here why the observed relationship between the amplitude of the fluctuations and the scale obeys a single power law (close to the Kolmogorov power law), when the noise is of a different nature on different scales.
As became clear during a discussion with Wilkinson at IAU Symposium
104, nonthermal emission at high latitudes with a brightness-temperature
spectral index of approximately 2.6 and the parameters observed by us explains
the quadrupole component in the brightness distribution of the sky at millimeter
wavelengths without using the theory that the cosmic background radiation
has a significant quadrupole component.
8.2. Nearby Regions of the Milky Way
We shall now discuss the nature of the centimeter-wavelength radio
emission near the Milky Way. The background emission of the Milky
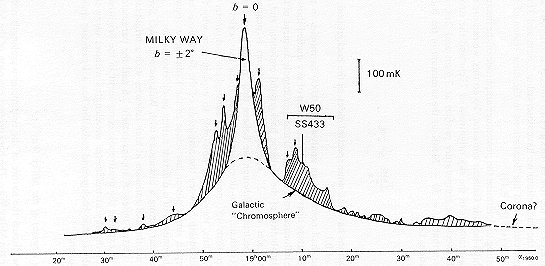
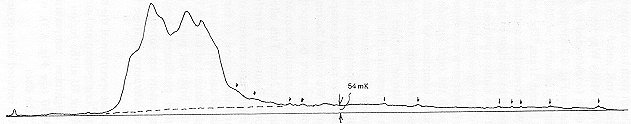
Figure 8.4 A cross-section through the Milky Way near
the anticenter (l = 210o); background emission
is visible to the right of fhe well-known Rosette Nebula.
Way has never been studied with such high temperature sensitivity and
angular resolution (better than 1 mK and q ![]() 1').
1').
The average drift curve of the Milky Way for all of the "quiet" days in Experiment Cold-1 at 7.6 cm (constructed by A. V. Temirova and N. E. Gol'neva) are presented in Fig. 8.3 for the region l = 137o and Fig. 8.4 for the anticenter, the region with I = 210o. Analogous curves were constructed for 3.9, 8.2, and 31 cm. The centimeter-wavelength radio emission of the Milky Way toward the anticenter was detected for the first time (see the background to the right of the well-known Rosette Nebula). It turned out that the radio emission in the vicinity of the Milky Way consists of the following: a bright band (1o wide) near the galactic equator (b = 0o); a fainter glow encompassing latitudes up to 15o (which then blends in with the high latitude radio emission via low-constrast features); intricate complexes of radio emission near the equator, as well as at intermediate latitudes; and, isolated discrete radio sources and "small scale" emission or "ripples" with an amplitude of a few millidegrees in antenna temperature. The 31 cm and 3.2 cm results obtained in the same experiment (Experiment Cold-1) can be used to study the spectrum of each of these components. In order to verify that all of the observed components were real, we compared the 7.6 cm drift curve with the 8.2 cm drift curve. We remind the reader that the primary feeds at the various wavelengths were not superposed; the times at which features pass through the antenna beam are different for each wavelength (including 7.6 and 8.2cm). This allows features due to atmospheric emission and other sources of interference to be distinguished from real features in the radio emission of the sky.
The drift curves of a particular region of the Galaxy at 31, 8.2 and 7.6cm should be compared cautiously, since even at 7.6cm, the vertical beamwidth of a single element of the RATAN-600 is comparable with the thickness of the brightest portion of the Milky Way. Moreover, the transformation coefficients between antenna temperature and brightness temperature are substantially difterent at 7.6 and 31 cm. A preliminary consideration of these factors leads to the following results:
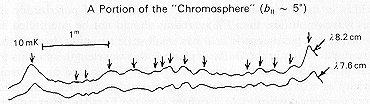
(1) The brightness temperature spectrum of the bright portion of the Milky Way, the "intermediate" component and almost all of the complexes (of which there are about 10 in the regionFigure 8.5 An example of a section of the "chromosphere" of the Galaxy, with a high density of features 1' 3' in size visihle at wavelengths of 7.6 and 8.2cm (arrows). The density of' these features is approximately 106 sr-1, and the average flux density of the emission is several mJy. At present, the nature of these features is unknown.15o in bII is non-thermal, with a similar brightness temperature spectral index g = 2.55
(2) The surface density of the isolated features detected in an interval
of(3) The small-scale "ripple" actually consists (see Fig. 8.5) of a large niimber of features 1' – 10' in size, and it gives rise to unusual spatial noise in the Galactic radio emission. The surface density of such features is 106/steradian. Hence, we are discussing either a new population of Galactic radio sources or very small-scale structure in the background radio emission of the Milky Way.
(4) It somewhat unexpectedly turned out that most of the flux in the background radio emission of the Galaxy originates in the high latitude regions (b > 2o) rather than the Milky Way. We estimate the contributions from the Milky Way, the "intermediate" subsystem ("chromosphere"), and the "corona" to be the following:
|
|
|
|
|
|
Unfortunately, there is no unambiguous answer to the question of what the nature of these components is. We shall merely list several variants here:
The region b > 2o. The standard explanation is non-thermal synchrotron emission from the Milky Way. We used the results of the polarization observations at 8.2 cm to find out how uniform the magnetic field is in this region. However, the total absence of polarization at this wavelength (less than 1%) certainly should not be interpreted as evidence that the magnetic field has small-scale structure. In fact, the Faraday rotation in the Galactic plane at this wavelength amounts to tens of radians, even for a field of 3x10⁻⁶ Gauss and an electron density of 0.05 cm-3 . Therefore, the polarized component emergent from the region where tF < 1 (where ~" is the Faraday effect optical depth) turns out to be several orders of magnitude smaller than the unpolarized component, and the percentage polarization will be sharply reduced, even for a uniform magnetic field. Several of the larger complexes have been well-studied (for example, W50 with SS433 in the center). The others may be either supernova remnants (there would then be about 3000 in the Milky Way, including the "chromosphere") or simple irregularities in the non-thermal background.
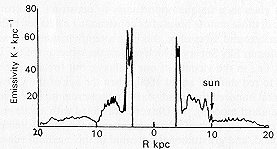
At latitudes b > 2o, we notice polarized structure in the background at 8.2 cm, which supports (or is not inconsistent with) the supernova alternative. The "intermediate" non-thermal background, or, by convention, the "chromosphere", may have at least three explanations: radio emission from a truly "intermediate" component of the background radio emission of the Galaxy (or a denser "corona"), emission from the nearest spiral arm interior to the Sun, or radio emission from very distant arms which are raised above the plane of the Galaxy. At present, we tend toward the first alternative. At the same time, we believe that the background near the Rosette Nebula is emission from the nearest exterior spiral arm. In Fig. 7.6, we remind the reader of the current interpretation of the structure of the background radio emission of the Galaxy obtained (by modeling) from the best existing results on the distribution of non-thermal radio emission at 73 cm (Pauliny-Toth et al., 1978). It seems entirely possible that the brightest portion (b < 2o) is formed by background emission from the region R < 5 kpc from the center of the Galaxy; the radio emission in the region 2o < b < 7o is due to the nearest interior spiral arm of the Galaxy, and the background in the vicinity of the Rosette Nebula (which has a brightness spectral index of 2.55) is emission from the region 15 kpc < R < 20 kpc (see Fig. 8.6). In the latter case, we can also determine the half-thickness of the region of non-thermal radio emission at large distances from the center of the Galaxy. This quantity turns out to be equal to 250 – 400 pc.
The individual features may be ordinary H II regions; however, we do
not yet have any information on the spectrum of their radio emission. The
nature of the very small irregularities, or "ripples" is more
 H kpc
H kpcenigmatic. First of all, it is not clear whether we are dealing with a new population of discrete radio sources (H II around white dwarfs, starts with envelopes, microsupernovae, Compton scattering around giants, etc.) or very fine structure in the background emission. The ripple occurs in regions where there is gamma-ray emission and emission in the H I and CO lines. It is tempting to say that this radio emission comes from small condensations of cold gas, which are penetrated by cosmic rays and where relativistic electrons are created in collisions with neutral gas and dust. The emission from such consendations will be strongly amplified in magnetic fields compressed by gravitational instability.