|
|
|
|
|
5.1. Statement of the Problem
The observer must resign himself to the fact that it is senseless to
attempt to actually attain the potential sensitivity of modern radio telescopes
without ever using any a priori information about the object being
studied and extremely careful study of the properties of all kinds of additional
sources of noise.
Having a definite set of observing possibilities in hand, the observer
chooses the method of observing and data reduction which, as it seems to
him, will lead him most rapidly to the solution to the problem at hand.
However, being unable to change this set (as in Experiment Cold, where
the capabilities of a particular type of radiometer at 7.6 cm were under
study), the observer is forced to decide what observational problems he
can solve with these means (in the presence of internal and external interference
which hinders the receiving of signals).
The problem in Experiment Cold were formulated in just this way.
Without going into details, we shall merely note here that the personal
experience of RATAN-600 observers and a study of published data led us
to believe that a search for small-scale features (comparable in size to
the antenna beam) would be limited by the thermal fluctuations DTn
in individual scans, but that on sufficient averaging (10 – 30 scans) it
would be limited by confusion noise (spatial sky noise). A search for extended
features will always be limited by atmospheric noise sources.
It is remarkable that even these beliefs, which seemed obvious to us,
turned out to be erroneous – when using extremely sensitive radio-meters,
one frequently experiences a "wealth of surprises"; radio astronomical
data are too uncertain at surface brightness levels of 1 mK or flux densities
of 1 mJy. Looking ahead, let us say that we greatly overestimated the role
of sky noise due to background sources (there turned out to be fewer of
them than expected from all earlier published data) and underestimated
the role of Galactic emission at high galactic latitudes. So, when posing
the problem, we chose to improve the statistics of faint (all the way down
to the sky noise) radio sources and study the fluctuations in the brightness
of the cosmic background on the "optimum" scales for standard cosmology:
5 – 10'.
In order to make the best use of the length of time between successive servicing of the cooled amplifier (3000 h of continuous operation) and save telescope observing time, a "deep survey" mode was chosen; in this mode, the same strip of sky was observed for the first two long observing cycles (Cold-1: 3 months, and Cold-2: 1 month). In this mode, information on the radio emission of the sky is gathered almost continuously, without loss of time due to resetting the radio telescope.
The selection of the region of sky to be observed was made on the basis
of two conditions: the condition that the antenna noise temperature be
as small as possible (intermediate elevations) and the condition that a
sufficiently interesting region of the sky where long-term patrolling at
high sensitivity might intrinsically be of interest fall within the area
surveyed. The region around declination d =
4o 54', contains the object SS 433 (object No. 1 in astronomy
in 1979), and is at an intermediate elevation when observed on the meridian,
where the antenna noise is rather low, is such a region.
5.2. A List of the Problems Studied in the Deep-Survey Cycles
For completeness, we shall list the complete set of problems which we expected to treat using the data from a deep survey of the band of sky
5.2.1. Discrete extragalactic radio sources
(1) Construct the log N – log P (number of sources – flux density) curve in the region between 14 and 1 mJy, which had not yet been studied in 1980;
(2) Compile a catalog of all the sources observed in the survey, determine their coordinates (a,d), identify them optically, and determine their nature;
(3) Make an attempt to determine the spectra, structure and variability
of sufficiently strong radio sources; and
(4) Verify the isotropy in the distribution of sources over the sky
in the region chosen (a search for traces of clustering).
5.2.3. The Galaxy
(2) Make a deep cross-section through the Galaxy, with an attempt to observe radio emission far from the plane of the Milky Way, as well as toward the anticenter. We remind the reader that all of the centimeter-wavelength maps of the Milky Way stop abruptly at latitudes b of a few degrees.
(3) Search for new sources in the Milky Way, including faint supernova remnants with a surface brightness of approximately 1 mK.
So much data was obtained during the two cycles in which the chosen
strip of sky was observed (3 months at the meridian and 1 month at an azimuth
of 30o – north – northeast) that it was decided to suspend further
observations in this mode until a real-time data reduction system is developed.
The later observing cycles using the new cooled 7.6-cm radiometer involved
studying individual regions of the sky. Let us list the problems which
were studied.
(2) A search for traces of the interaction between "relic" photons and the hot gas in clusters, together with the Bonn radio telescope (the Sunyaev-Zel'dovich eftect);
(3) Studying several regions of excess star formation;
(4) A quick survey of peculiar galaxies (from the Byurakan Observatory lists);
(5) A search for the "ghosts" (antipodes) produced by radio sources in closed models of the Universe and in Lemaitre-type models with "delays";
(6) A quick survey of compact H II regions from the lists of the Max Planck Institut fiir Radioastronomie in Bonn (the "Mezger Lists");
(7) A search for variations in the lunar subsurface temperature; and
(8) Verifying the existence of extended radio emission beyond the earlier-known
radiation belts of Jupiter.
Of course, each of the problems listed above assumes that some a priori information which makes it significantly easier to solve the problem of detecting faint signals against a background of noise is available. Before describing the signal detection methods we used, let us make a note of the goal which we should strive for: the data reduction procedure should ensure that the signal-to-noise ratio is as close to the "ideal" value (i.e., that determined purely by the thermal radiometer noise with a filter which is the optimum for a given problem (assuming that all the additional sources of noise are absent)) as possible.
We have compiled a table (Table V.I) giving the "ideal" sensitivities for appraisal.
The sensitivity expected from the "ideal" estimates will be defined more accurately later, since the estimates are sensitive to the amount of a priori information, even for a fixed scale. The closer the result of the data reduction procedure is to this table, the better the observer has coped with the problem of dealing with the sources of interference. The observer must carefully think about why he is not able to achieve the values in this table, as well as just how insuperable the difficulties really are.
We shall divide all the types of radiation which are present in the final set of data into those which are random (interference, atmospheric noise, radiometer instability, variations in the emission from the ground and feed horn, etc.) and those which are systematic, i.e., those which repeat
"Ideal" antenna temperature sensitivity
|
|
|
|
|
|
|
("point source") |
|
|
|
|
("protoclusters and the background in clusters") |
|
|
|
|
("horizon" at the recombination epoch) |
|
|
|
|
the dipole and quadruple components; the Galaxy at high latitudes) |
|
|
For averaged scans, the amplitude of the systematic eKects is independent
of the number of observing days N, but the amplitude of the random
ones typically falls off as ![]() .
For rare, isolated interference, the amplitude falls off as N, while
for slow, "quasiperiodic" interference (similar to the diurnal variations
in the emission from the ground), averaging proceeds extremely slowly,
according to the law cos 2p (N/360). A spectral
analysis of the results from observations over many days allows one to
estimate the contribution from the "systematic" and the "random" radiation
on various scales. We shall now give the results of such an analysis. Selected
coefficients in the Fourier-series decomposition were calculated for the
sum of two groups (I + II) of the best 24-hour-long scans and the half-difTerence
of the same two groups (I – II). If the random noise dominates (from day
to day), the coefficients of the decomposition for the half-sum and half-diH'erences
of these groups ought to be similar, since the sum and difterence of two
independent noise signals yield a statistically identical result (i.e.,
identical power spectra). If the "systematic" noise dominates, it will
be absent in the half-difference of the two groups of observations. In
the intermediate case, we can estimate the role of the signal and noise
separately from the values of C2(I – II) and C2(I
+ II) – C2(I – II) = C2(signal). Each of these procedures
were carried out for 10,000 selected estimates of the Fourier harmonics
from a period of 24 h (the first harmonic) to a period of 3 s (the last
harmonic). First, 10 harmonics from a 24-h scan (an average of 13d),
10 harmonics from a 1-h scan (an average of 22d"), and finally
10 harmonics from a section of length 0h.1 and 10 harmonics
from a section 1m long were calculated. The results of the analysis
are presented in Fig. 5.1. It is obvious that the values of the sensitivity
expected on various scales for the average of 22 days of observations are
quite different from the ideal sensitivity. At the lowest frequency (periods
of order 24h) the background emission of the Galaxy dominates on good days,
and the "ripple" in the galactic emission predominates over the atmospheric
emission when it is averaged over many days on scales of 2o.
On the smallest scales (comparable with
.
For rare, isolated interference, the amplitude falls off as N, while
for slow, "quasiperiodic" interference (similar to the diurnal variations
in the emission from the ground), averaging proceeds extremely slowly,
according to the law cos 2p (N/360). A spectral
analysis of the results from observations over many days allows one to
estimate the contribution from the "systematic" and the "random" radiation
on various scales. We shall now give the results of such an analysis. Selected
coefficients in the Fourier-series decomposition were calculated for the
sum of two groups (I + II) of the best 24-hour-long scans and the half-difTerence
of the same two groups (I – II). If the random noise dominates (from day
to day), the coefficients of the decomposition for the half-sum and half-diH'erences
of these groups ought to be similar, since the sum and difterence of two
independent noise signals yield a statistically identical result (i.e.,
identical power spectra). If the "systematic" noise dominates, it will
be absent in the half-difference of the two groups of observations. In
the intermediate case, we can estimate the role of the signal and noise
separately from the values of C2(I – II) and C2(I
+ II) – C2(I – II) = C2(signal). Each of these procedures
were carried out for 10,000 selected estimates of the Fourier harmonics
from a period of 24 h (the first harmonic) to a period of 3 s (the last
harmonic). First, 10 harmonics from a 24-h scan (an average of 13d),
10 harmonics from a 1-h scan (an average of 22d"), and finally
10 harmonics from a section of length 0h.1 and 10 harmonics
from a section 1m long were calculated. The results of the analysis
are presented in Fig. 5.1. It is obvious that the values of the sensitivity
expected on various scales for the average of 22 days of observations are
quite different from the ideal sensitivity. At the lowest frequency (periods
of order 24h) the background emission of the Galaxy dominates on good days,
and the "ripple" in the galactic emission predominates over the atmospheric
emission when it is averaged over many days on scales of 2o.
On the smallest scales (comparable with
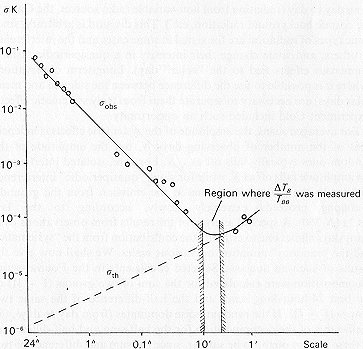
the size of the antenna beam), the contribution from faint, background
radio sources dominates. We believe that the radiometer noise is dominant
only on scales of 5'-10'. Thus, using a new-generation radiometer fundamentally
changed the situation of previous years; at that time (see Pariiskii, 1972),
the radiometer noise dominated on all scales smaller than a degree, and
atmospheric noise dominated on all scales larger than 1' . Thus, in the
region studied in our survey, we saw practically nothing beyond our atmosphere.
The methods used to reduce the data from Experiment Cold in an effort to
decrease the influence of the various sources of interference (i.e., to
make the curves sobs and stheor
in Fig. 5.1 converge) will be discussed in the next section.
To conclude this section, we will give a table of selected values of
the
| Scale, deg |
|
Scale, deg | Amplitude, mK |
| 360
180 120 90 72 60 51.4 45 40 15 75 5 3.75 3 2.5 2.1 1.88 1.67 |
72
57 33 43.2 29.8 20 17.4 12 4 0.7 1.58 0.95 0.28 0.11 |
1.5
0.75 0.5 0.38 0.3 0.25 0.21 0.19 0.17 0.4 0.2 0.13 0.1 0.08 0.07 0.057 0.050 0.044 |
0.7 0.4 0.38 0.38 0.17 0.12 0.07 0.04 0.04 0.04 0.04 0.05 0.11 0.07 |
amplitudes of the Fourier spectrum of the drift curve (averaged over 22 days) of the band of sky under study. The values of the harmonics of the Fourier decomposition for the sum of two 11-day cycles C(I + II) were compared with the amplitudes of the harmonics of the Fourier decomposition of the difference of the same 11-day observing cycles C(I – II). In order to remove the random noise, the quantities