|
Neutral hydrogen is an important constituent of the interstellar medium,
and has been widely studied at 21 cm line emission. Within the Galactic
plane, structure of HI emission is seen over wide range of angular scales,
down to tens of milliarc seconds.
In the most cases distinct "clouds" of HI are found to be associated
with filaments, shells or sheets of gas.
In the high galactic latitudes an alternative approach is seen more
reasonable - to describe HI emission in terms of an angular power spectrum
over a range of scales.
A power spectrum analysis was made of RATAN-600 HI observations in the
region of 10h < R.A.< 16h and Delta = +5.0 degree,
+16.0 dg, +27.5 dg and +39.0 dg, that is 45 dg < b < 90 dg.
The angular resolution of this Survey is 2.4'x 130', velocity
resolution is 6.3 km/s, r.m.s. fluctuations of antenna temperature is 0.1 K.
Velocity profiles of the HI emission in the whole of this region may be
clearly divided into two parts: rather narrow picks near zero velocity and
the very broad emission which is obviously arised from far (mainly - back)
sidelobes of our antenna. It was shown that only narrow emission has fine
angular structure and therefore came from main beam of antenna.
Angular power spectrum was computed in each velocity channel with standard
FFT code and smoothed over 5 velocity channels (22 km/s) and 1h (15 dg)
along R.A. Before FFT computation a linear trend was removed and data were
multiplied by cos-window. The power spectra of system noise were determined
on the spectral channels where the line signals were absent and subtracted
from measured spectra on the line channels.
After that the obtained spatial
spectra were corrected for two-dimensional antenna beam and output RC-filters
smoothings. The used range of angular scales was chosen from 6' to 192'
in one dimension (R.A.).
Measured HI column densities are represented on the Figure 1 as a function of
sin b, that is inversely proportional to the length of line of sight for
the plain layer of galactic gas. Straight line on the figure represents the
linear regression of the whole data except for declination of +39 dg.
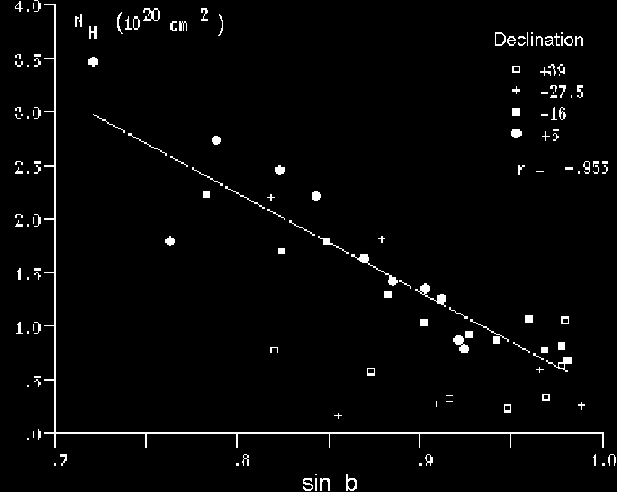
Figure 1. HI column density in the region surveyed at V near zero.
It is seen that for these cross-sections the correlation is rather good
(coefficient of correlation is 0.95) and this means that the gas layer is
really flat. There is a region with extreme law HI contents namely
11h < R.A.< 12h30m and +27 dg< delta < +39 dg
where we can't measure the spatial spectra.
R.m.s fluctuation of HI line intensities filtered in the range of angular
periods from 6' to 48' after subtraction of system noise are presented
on Figure 2. It seems that r.m.s. became higher at high galactic latitude may
be due to lower quantity of clouds.
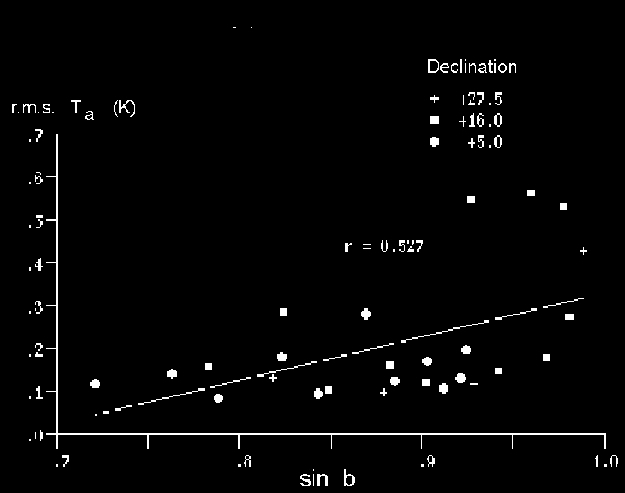
Figure 2. HI r.m.s. fluctuation at angular periods from 6' to 48'.
Finally, the indexes of HI spatial power spectra are presented on the Figure 3.
It is seen that there is clear dependence the values of indexes from R.A.
providing more flat spectra at more high latitude. Commonly used values near
-3 is seen only at rather law latitudes. Implication of these results to
the properties of interstellar matter will be done in the next time.
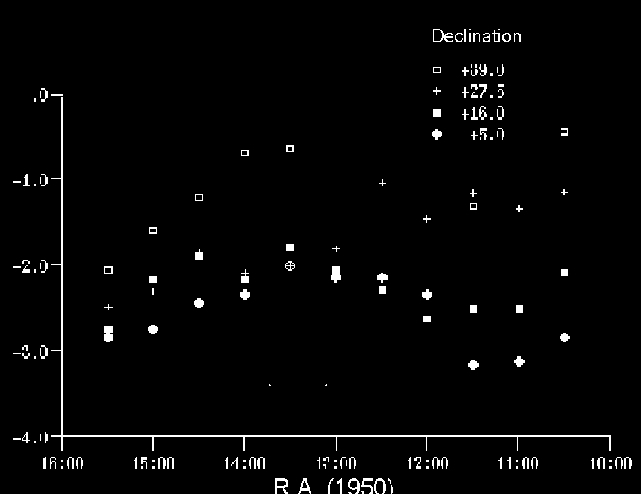
Figure 3. The indexes of HI spatial power spectra at periods from
6' to 192'.
|