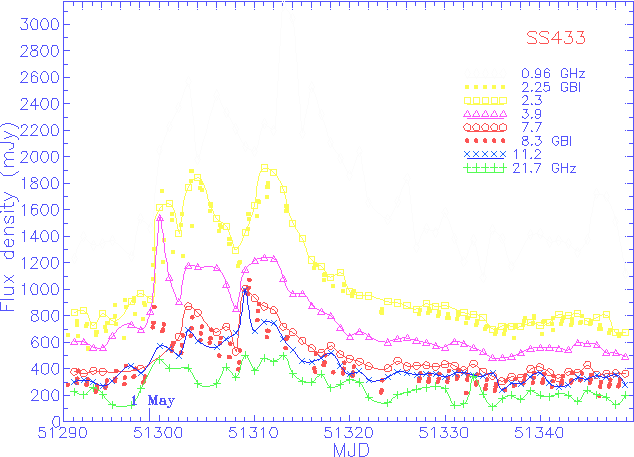

Also we show the Green Bank interferometer data at 2.25 and 8.3 GHz^(1).
Quiet spectrum is equal to Snu = 1.3[Jy]nu-0.61+- 0.02 .
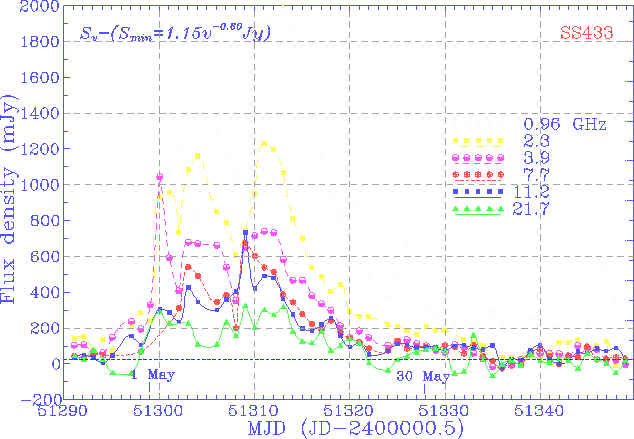
Minimum flux spectrum is equal to Snu = 1.15[Jy]nu-0.60+- 0.02 .
Radio spectra in some days of the flare
with comparison with quiet spectrum.
The lower plot is the light curves of the flare
Snu - Smin.


(1)The Green Bank Interferometer is a facility of the National Science Foundation operated by the NRAO in support of NASA High Energy Astrophysics programs.